Month: May 2014

Objective
We discussed our objective. I mentioned the idea of making a very simple demo of the fundamentals and trying to get in front of honchos at Apple, etc. I described a possible demo where
- the demonstrator moves around a conference room being tracked
- shows cluster analysis of settling areas
- A carefully enacted repeating sequence generates a pattern that is recognized
- An excursion from the pattern is recognized
- A trend is recognized
- A location of a lost object is described.
- A prompt issued near to an object is demonstrated – pills. c.f. this link
- The demo finishes with an explanation of the key features of what they have seen, and the architecture behind it
Patent
We discussed whether we should try to patent the above ideas before we go much further. Would a quick and dirty filing be better than none at all. David to peruse patent book and decide how daunting it seems?
Enclosure
We looked at the enclosures we had and tried to decide which was best. David will poke around and see if there is something better to be had.
Battery
We discussed batteries. Decided that removable AAA was the easiest option, but we would end up using the TS02 box. Then we investigated using the wrist enclosure and found some lithium ion candidates that might do.
Layout
We realized that the battery for the wrist enclosure would probably occlude the antennae, and discussed ways to arrange stuff so that it didn’t.
Components
We made a list of possible components to go into Dewbly 0.1, and prioritized them
- DWM module
- Nordic + RTC + battery backup
- IMU
- JTAG connector
- PSU
- Battery
- uSD card
- Coulombe counter
- Beeper
- Solar charger
- LEDs / display
- Barometer
- Push button
M:
Phew, I’m bushed. This was hard work, but I think it’s quite illuminating.
Phew, I’m bushed. This was hard work, but I think it’s quite illuminating.
D:
I can see it. Yes, it looks like it was a lot of work. I think it was an excellent approach.
To make sure I understand, where the range radius intersects the dotted line is where DW thinks you were, correct?
When you went to the end of the bedroom and there is no measurement, does that mean the DW didn’t give a reading, implying that is the maximum range?
Some areas are repeatable and some areas are not. It seems like it really doesn’t like being around metal, or having the signal propagate close to metal, which isn’t surprising.
A challenge for the hardware challenged… it doesn’t work on the battery.
I tested the battery and it is indeed around 4v2. So I tested the final connector and discovered 0v0. Working my way back up the chain it turned out to be the most unlikely thing… notice the little plastic nib sticking out.
Furthermore, notice that the battery cap doesn’t have a little nipple like most?
Out with the Stanley knife…
| 30cms estimates as 10cms, but hey… we are talking centimeters now. |
Isn’t it always the case that we struggle over these simple things more than everything else. The trouble is that all this kind of stuff is second nature to you, but advanced physics and logic to me. We have what you might call an interpersonal impedance mismatch.
To be fair, the battery issue was one of those unlikely, Sod’s Law things. There was exactly one way that you could put the battery in and have it make contact. That was if it was not completely seated, and also it was canted in the holder. If you disturbed it, or put it in any other way, including fully seated, it would not make contact.
So when testing it I held the probes hard against the ends to make contact, and… of course… the battery would get pressed against the terminal too, and I’d would get a reading. But put it all back together and measure the output at the board and I got nothing. So Einstein figures it must be a dry joint of some sort. So he re-melts all the joints with the iron, and still no good.
So now I test end-to-end continuity. Why didn’t I do that at first, as you would have done? And there is continuity. So now I’m really puzzled, and have to sit and think for a while. How can there be continuity from inside the battery holder, right the way to the connector, but the power doesn’t make it from inside the battery to the end of the connector?
Obviously it was some sort of Van der Waal force in action, so I measured the Keyson, Debye, and London dispersion forces using my portable Hadron Collider I finally figured that there was a large Dandylinium Chloride molecule stuck in the Phlogiston gate. After that it was a piece of cake.
Here’s some quick and dirty results. You have to imagine all the furniture. I placed the anchor on my desk, and then walked the tag around to various places. I let the estimates average out over a dozen or so measurements.
The green boxes show successful estimates. The numbers inside the box are <Actual> / <Decawave Est>. The pink boxes are where it failed to get an estimate.
 |
| Click on image to enlarge |
Thoughts
- This is clearly better than Nanotron.
- The one true LOS estimate I made is really is really good.
- It seems to take a long time to get an estimate – and meanwhile it is burning power.
- The two failed estimates that are up near Brenda’s desk (top of page) have to pass through at least one layer of glass, or outside metal/concrete wall.
- The failure in the bedroom is quite a long way.
- The failure in the bathroom, has to pass through a large plate-glass mirror.
- Many estimates are around +/- 500cms, but one is 30% wrong.
The next thing to do is to see how repeatable these estimates are, and what factors cause the estimates to fluctuate.
Excerpts from David’s response
It’s a little disappointing, isn’t it? What’s interesting is the inconsistency. The only commonality to the bad measurements seems to be glass. Are the closet doors in the master bedroom mirrored? Going through regular walls doesn’t seem to be a problem. Having to go through/close to metal appears to be a problem. That isn’t surprising.
It would be a PITA but measuring every square 6″-1′ in the main living area from the wall in the kitchen extending over to where Brenda’s computer is and over to about 1′ past the kitchen/nook wall would be interesting. Actually, mapping the whole living area would be interesting, but what PITA, and how would you mark all of those locations to be able to go back to them?
Since we were specifically asked to provide feedback to Decawave, picking a problem location and taking a bunch of measurements, demonstrating accuracy and repeatability, and then asking DW why it’s not working well there, might be worth the effort, as long as we have their attention.
I wish we had an instrument that could show what the RF looked like in a particular location. I don’t even know what that would be. A spectrum analyzer? But how do you look at a UWB signal on a spectrum analyzer since the bursts are so short?
The open space measurements are great. If there’s an anchor in every room it might work very well.
More thoughts
I was wondering about doing a careful survey of the whole place to see what kind of results I get. I’m trying to think of the best way to do the test.
Simply put, we need to see the ranging error from source to destination for all possibilities. If I had all the time in the world then I’d divide the whole house into small squares and check the Actual versus DecawaveEstimates ranges between every two squares. So a hundred squares would require 100*99/2 = 4500 measurements which I don’t think I have the fortitude, or time to do before I leave.
The other problem is how to represent the results if I had them to hand. There are more dimensions than we have eyes/brains to perceive. I need some kind of 5-D representation that plots src:<x1, y1>, dest:<x2, y2> against E<error>. I suppose I could simplify it by fixing src:<x1, y1> and simply plotting dest:<x2, y2> against E.
Imagine a 3D surface where height represents E at dst from a single src, perhaps even superimposed on a map of the apartment. 
Then I could somehow animate iterating over every possible src, so I can see how the topology changes.
That seems like a lot of work, and what might I see?
Seems like this might be a useful thing to play with to learn about harvesting.
http://www.cymbet.com/products/enerchip-energy-processor.php
$79! For a cable!
Let’s make a note of this while I have the information:
In-Circuit Plug-of-Nails Cables
Tag-Connect
Neil Sherman, President
Tag-Connect, LLC
433 Airport Blvd. Suite 425
Burlingame, CA 94010
Does the J-Link cable use the same connector?
Their cables aren’t cheap either: http://www.tag-
Digi-Key is a distributor but no stock.
I will call Neil Sherman next week to understand pricing of the various items.
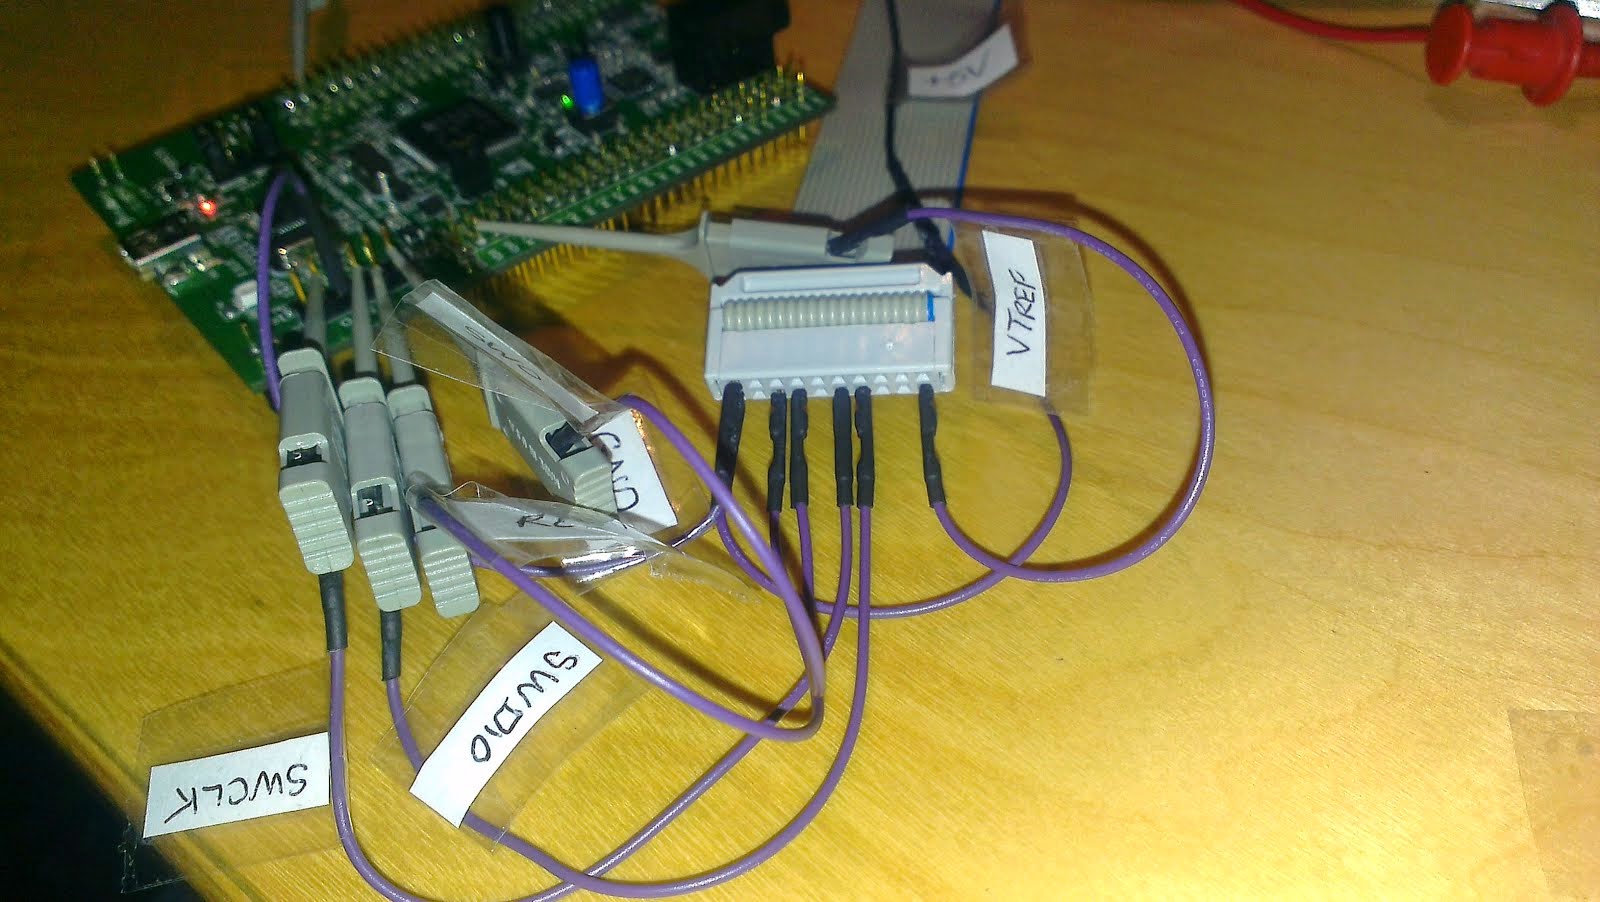
7 pins is all it takes: 1 7 9 13 15 19 20 on the 20 pin connector.
As you can see, those little scope probes are very helpful.
//Mik (mobile)
Update: I’m not sure that’s quite enough. I can’t get one of the processors to halt, and restaart with just these connections, but another processor works with all 20 connections.
I cast my eyes over the DW docs. They look useful and well written. I think the most interesting documents to scan initially are:
EVK User Manual – section 4.4
User Manual sections 2.2, 4.4, 4.5, 6, and 9 I think I should read this thoroughly on the plane to the UK.
I'm pretty excited by what I see, but on the other hand I'm worried about the power numbers and await your thoughts.
//Mik
http://senseg.com/technology/senseg-technology
I wonder if it would be possible to use something like this to create a range of different haptic feedback experiences to a ring/wrist-band wearer. Several different types of discrete alarm?
I imagine the power requirements are too large, but it's interesting.
Senseg patented solution creates a sophisticated sensation of touch using Coloumb’s force, the principle of attraction between electrical charges. By passing an ultra-low electrical current into the insulated electrode, Senseg’s Tixel™, the proprietary charge driver can create a small attractive force to finger skin. By modulating this attractive force a variety of sensations can be generated, from textured surfaces and edges to vibrations and more.
Unlike effects created by mechanical vibration and piezo solutions, Senseg is silent. With Senseg application developers have precise control of the location and type of effect users experience. What’s more, Senseg technology scales from touch pads, smart phones and tablets to the largest touch screens without increasing manufacturing complexity.
//Mik